


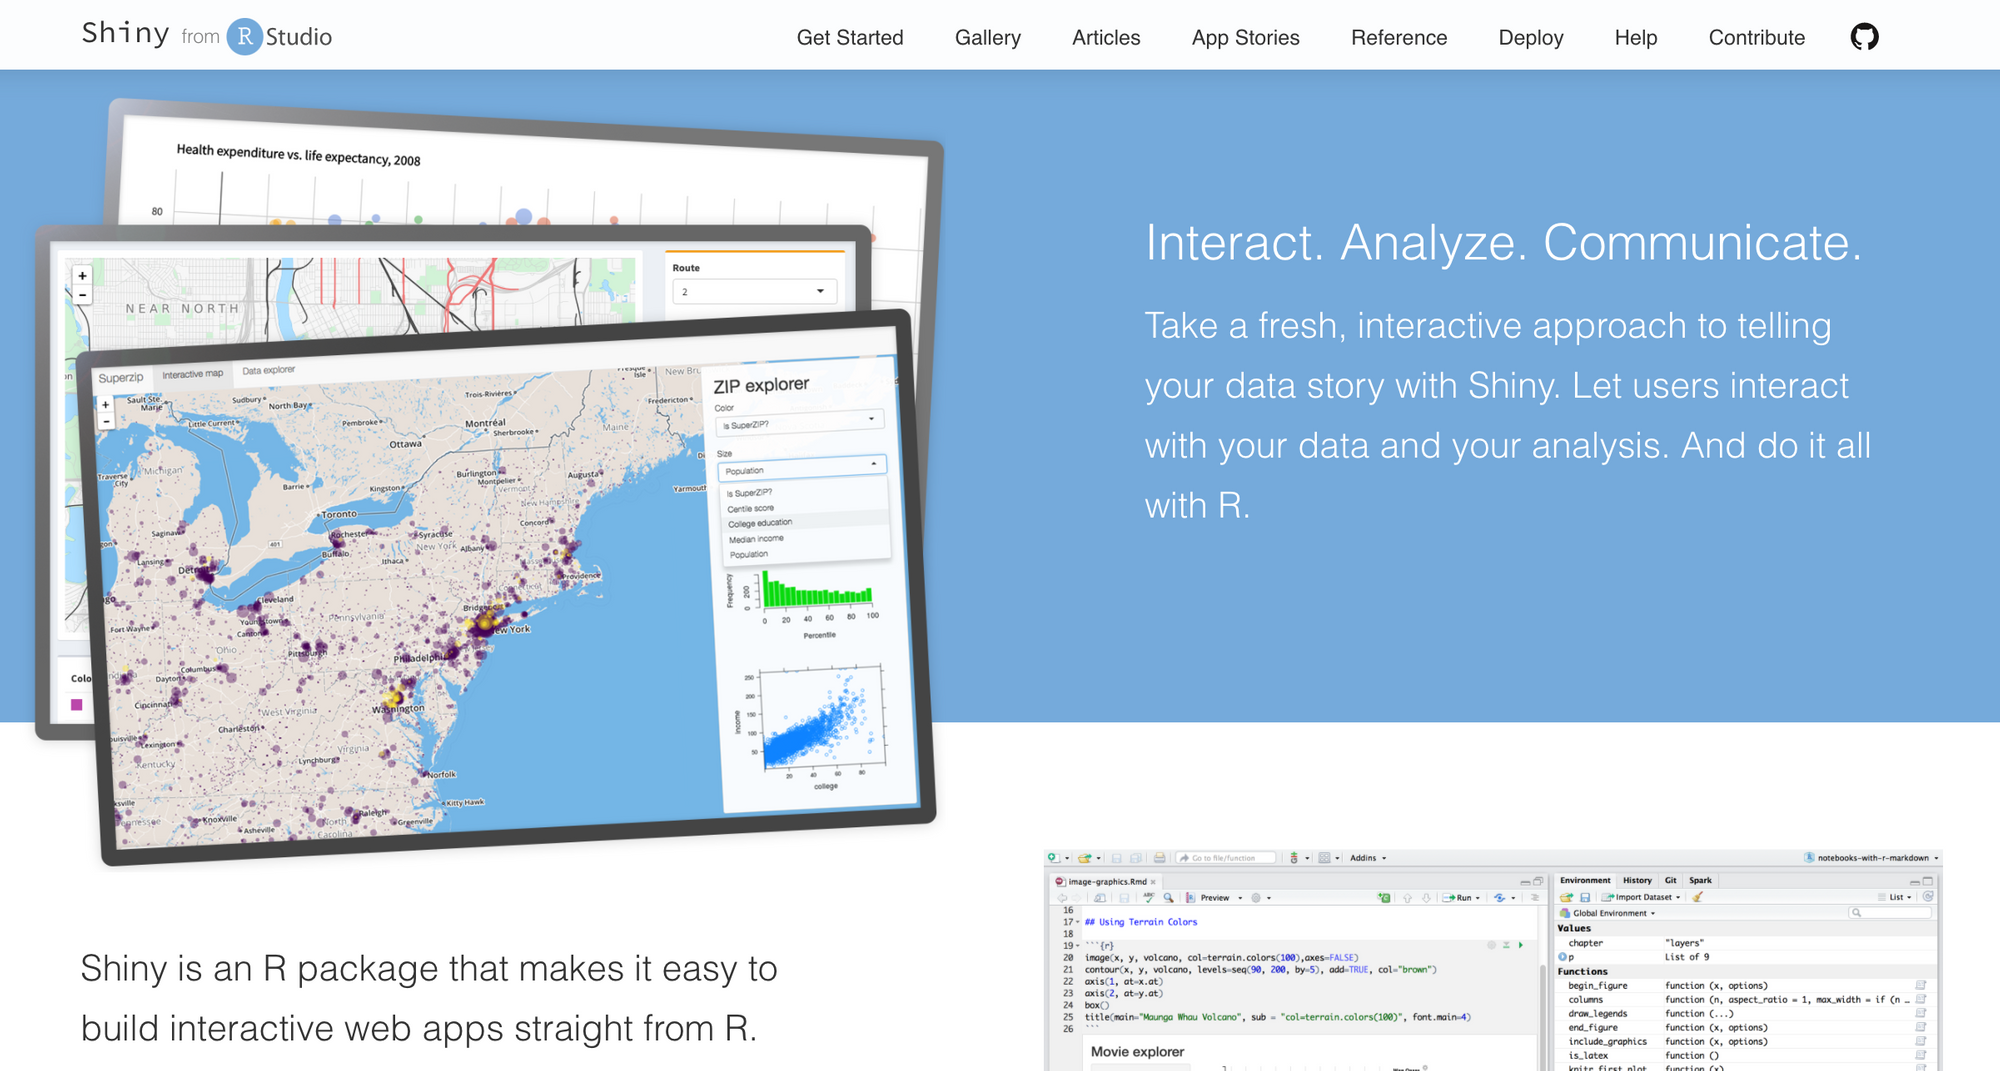
Shiny lets you quickly build web applications using the R programming language. In this post I will walk you through how a Shiny application is structured. The goal is simply to have the most basic and dependency free app that we can deploy. Let's get going!
Shiny lets you quickly build web applications using the R programming language. In this post, I will walk you through how a Shiny application is structured. The goal is simply to have the most basic and dependency-free app that we can deploy. Let's get going!
What is R and Shiny
R is a free software environment for statistical computing and graphics. It compiles and runs on a wide variety of operating systems. Visit the Comprehensive R Archive Network (CRAN) for installation instructions.
R, either using its base functionality or the tidyverse packages, is superb for both interactive and non-interactive use. Oh, and R has a dedicated and welcoming user community. Look for the #rstats hashtag on Twitter.
Shiny is an R extension package created by Joe Cheng of RStudio. Shiny makes it easy to build interactive web apps. This is the reason it is ideal for quickly making prototypes, but it is also a decent choice for building production-ready applications.
Shiny combines the power of R with the interactivity of the modern web. See this tutorial and the Mastering Shiny book by Hadley Wickham for accessible introductions.
Installing Shiny
Once you have R installed, it is also useful to have an integrated development environment (IDE): pick either the free RStudio Desktop or VS Code with R language support.
Install Shiny by running the following line in R:
install.packages("shiny")The structure of a Shiny app
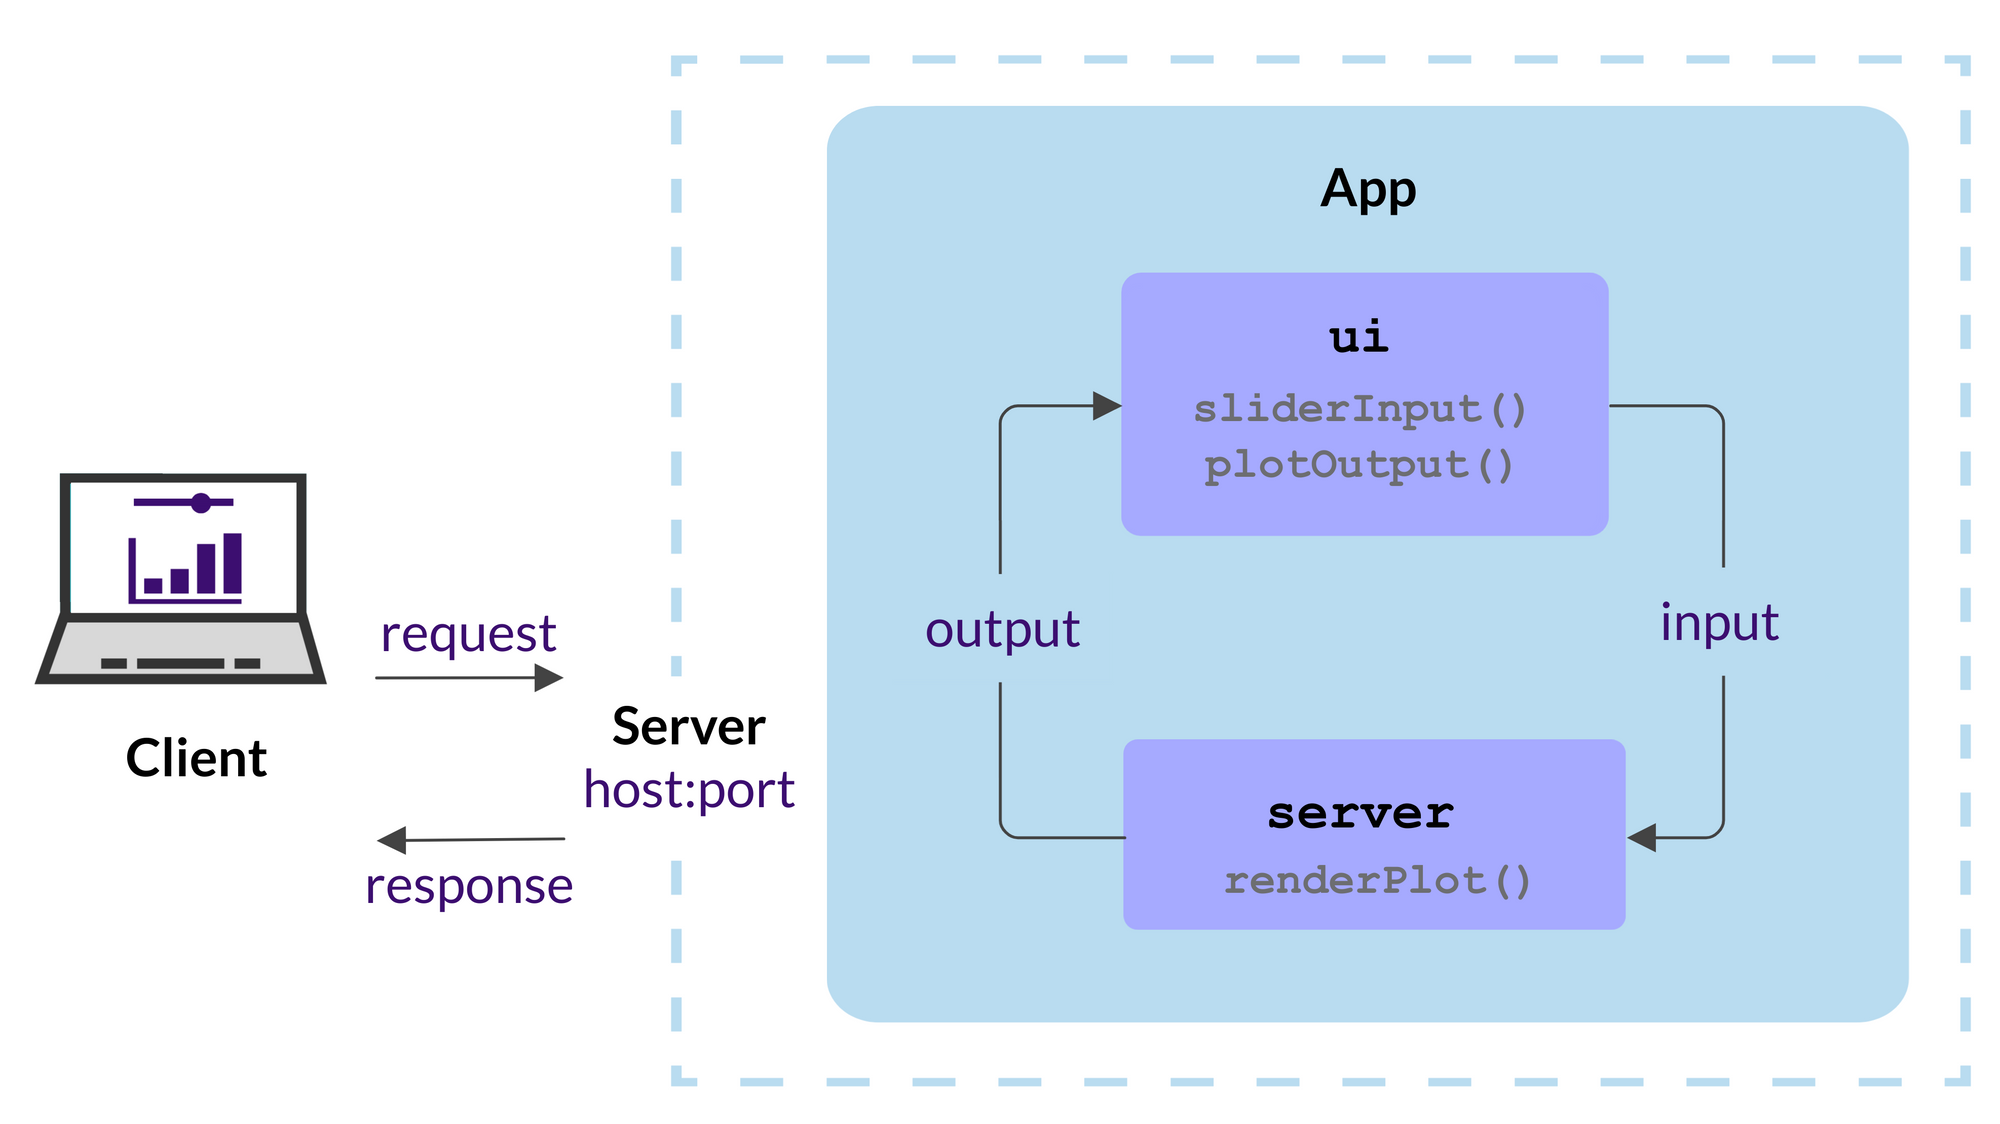
A Shiny app is made up of the user interface (UI) and the server function. The UI and the server can be written in pure R, but it can also incorporate JavaScript, CSS, or HTML code.
The app is served to the client (app user) through a host (Internet Protocol or IP address) and port number. The server then keeps a websocket connection open to receive requests. The R session behind the app will make sure this request translates into the desired interactivity and sends back the response, usually an updated object, like a plot or a table.
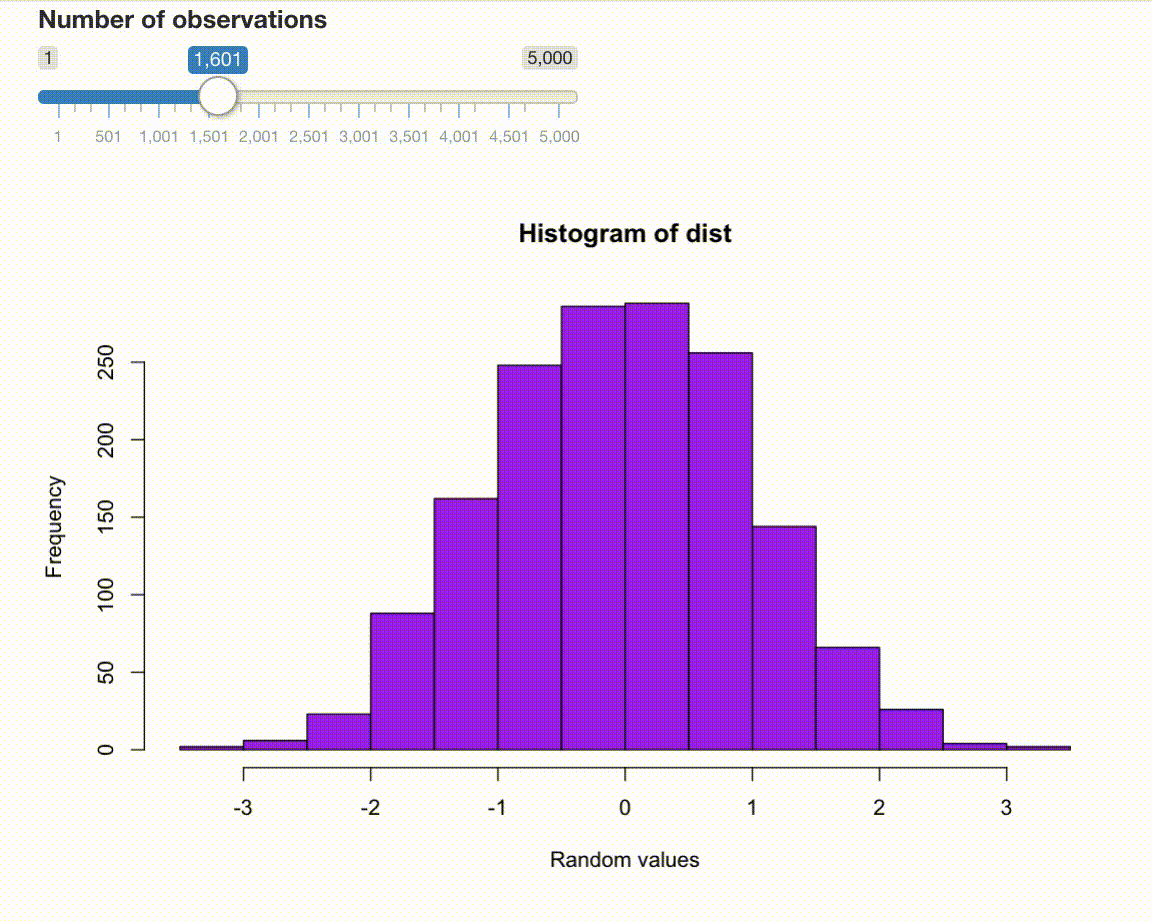
The following simple example draws a histogram of randomly generated numbers from the Normal (Gaussian) distribution. As you increase the number of observations, the shape of the distribution changes slightly. Here is how it will look:
Let's see what's inside.
The UI
The user interface (UI) object controls the layout and appearance of the Shiny app.
Load Shiny:
library(shiny)The UI is defined as:
ui <- fluidPage(
    mainPanel(
        sliderInput("obs",
            "Number of observations",
            min = 1,
            max = 5000,
            value = 100),
        plotOutput("distPlot")
    )
)
The fluidPage() function renders the main Shiny interface, a range slider input is nested inside of it alongside the plot output. The slider with the ID "obs" controls the number of observations (range between 1 and 5000, initial value set to 100). The plot with ID "distPlot" will show the distribution of the random numbers.
If we print the ui object, we get the following HTML output:
<div class="container-fluid">
  <div class="col-sm-8">
    <div class="form-group shiny-input-container">
      <label class="control-label" for="obs">
        Number of observations
      </label>
      <input class="js-range-slider" id="obs" data-min="1"
        data-max="5000" data-from="100" data-step="1"
        data-grid="true" data-grid-num="9.998"
        data-grid-snap="false" data-prettify-separator=","
        data-prettify-enabled="true" data-keyboard="true"
        data-data-type="number"
      />
    </div>
    <div id="distPlot" class="shiny-plot-output"
      style="width: 100% ; height: 400px"
    >
    </div>
  </div>
</div>
You can see here the fluid container, a column, and inside the single-column layout the range slider and the plot.
This is going to be added to the body of the HTML page rendered by Shiny. The final HTML page will also contain all the JavaScript and CSS dependencies required to make the app interactive and styled properly.
The server function
The server function contains the instructions for the reactivity needed for the Shiny app. The server function takes two arguments: input and output (sometimes also session). These reactive objects are created by Shiny and passed to the server function.
input is used to pass the control values, in this case, input$obs the number of observations. Notice how it is used to generate random numbers from the Normal distribution:
server <- function(input, output) {
    output$distPlot <- renderPlot({
        dist <- rnorm(input$obs)
        hist(dist,
            col="purple",
            xlab="Random values")
    })
}
The output object contains the output objects, in our case the rendered plot. input and output together describe the state of the app.
The Shiny app
With the UI and the server function, we can run the Shiny app locally:
shinyApp(ui = ui, server = server)Running this line will start the Shiny server locally that you can visit at the host and port printed in the R console (e.g. http://127.0.0.1:3884).
To be precise, the shinyApp() function returns the app object which is run either by implicitly calling the print() method on it when running in the R console. You can also pass the app object to the runApp() function.
The app you just made is very similar to the Hello World Shiny app (i.e. running runExample("01_hello")). Check out the Shiny gallery to see more apps in action. You might have noticed that we did not load any other R packages except for Shiny itself. This dependency-free Shiny app will be used in future posts as the basic example for deployment.
Further reading
Shiny UI:
Server function: